Does anomaly detection work for rare but recurrent events? The example I am looking at is the number of people going through the turnstiles of the NYC subway system. As expected, the rate peaks in the morning and is higher on weekdays than weekends. On federal holidays the rate matches the weekend pattern instead of the weekday pattern. While there are multiple days like this throughout the year, I don’t tell the model when these days will occur and they occur without any regularity. Of note there are a couple of these days in the initial 500 sample learning period; however, in that initial period they only occur on Mondays.
I would expect the model to detect an anomaly on Thanksgiving, as there is a weekend pattern on a weekday and the model has never seen that occur on a Thursday before, but this is not the case. Additionally, even though the model has seen some Mondays which follow a weekend pattern, since there is no pattern to when these occur should I expect the model flag them as anomalies? I know in previous posts there has been discussion of turning off learning when there are regular anomalies that you want the model to detect but not incorporate as part of the normal pattern. However, these anomalies are irregular and rare and so I would not expect them to be incorporated into the pattern, in a manner similar to what is seen in mismatch negativity for a rare oddball stimulus.
I am using the learned swarming parameters from the github and nupic 0.6.0.
Here is a plot of the data showing the time around thanksigiving:
The 500 records I was referring to was the default probationaryPeriod variable in nupic in which the anomaly_likelihood is set at 0.5, which after looking at the code is actually 388.
In total there are 1780 samples going from June 2016 to the end of March in 2017. Unfortunately, the data is only sampled every 4 hours.
I am using a modified version of the model_params found here. I switched the variable names and put in the appropriate min and max values, and have switched the code to work with nupic 0.6, i.e.,
‘model’: ‘HTMPrediction’, --> ‘model’: ‘CLA’,
tmEnable --> tpEnable
tmParams --> tpParams
I was able to incorporate getScalarMetricWithTimeOfDayAnomalyParams() into the code. The anomaly prediction does a better job, I think, and does detect an anomaly for the first federal holiday in the data set. However, it still does not detect Thanksgiving or Christmas as anomalies, although to be fair the data starts to become a lot more erratic around that time of year.
Here is the link to the corresponding gist dataset
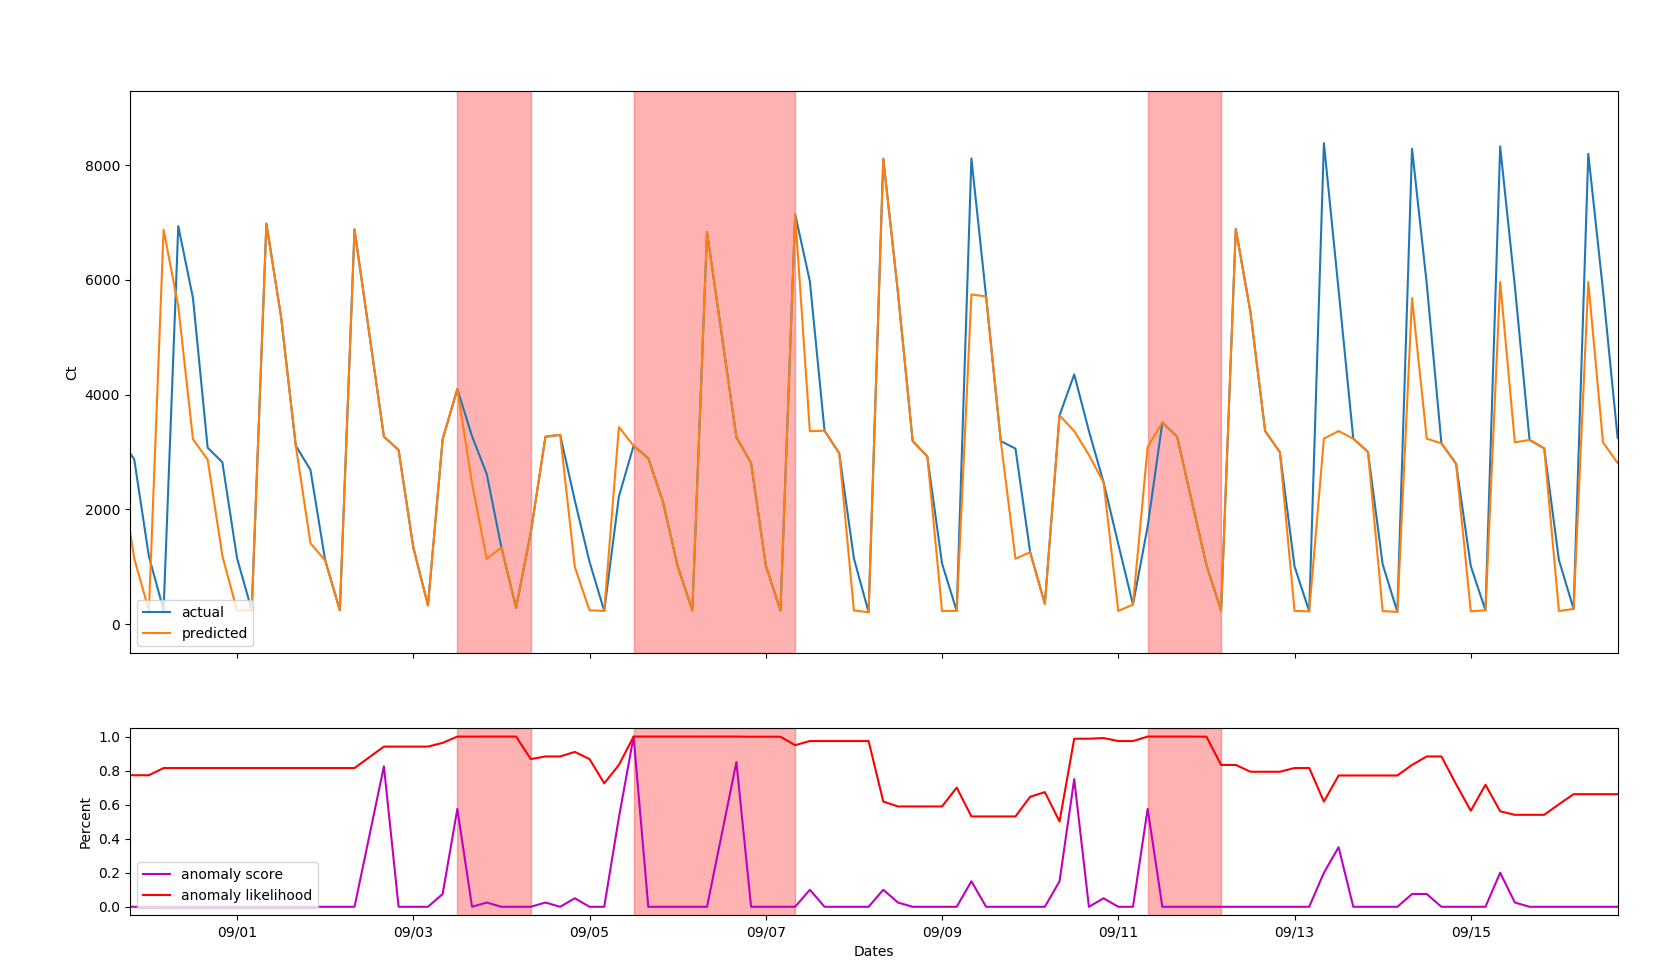
In addition to my original question about anomaly detection, a more general question is why is there a high anomaly likelihood (and often times a high anomaly score as well) when the prediction seems to perfectly match the data. Here is a screenshot of the same dataset showing anomaly detection as the highlighted area (don’t know how to do highlighting in plot.ly). For most of the highlighted area, the predicted perfectly overlaps the actual. I understand that the anomaly values are calculated from the active and predicted columns and not the actual and predicted values, but shouldn’t there still be some correlation between the two?
Just a note for anyone searching through the forums in the future, that using getScalarMetricWithTimeOfDayAnomalyParams() by default turns off prediction. If you want to enable prediction or have it work with the Hot Gym anomaly example, you need to add
A TemporalAnomaly model calculates the anomaly score based on the correctness of the previous prediction. This is calculated as the percentage of active spatial pooler columns that were incorrectly predicted by the temporal memory.
This means even though the model is creating decent predictions, it is also making a lot of extra predictions that are not coming true. This means there are several sequences it thinks it could be a part of. You could add a condition that includes actual prediction error to prevent these.