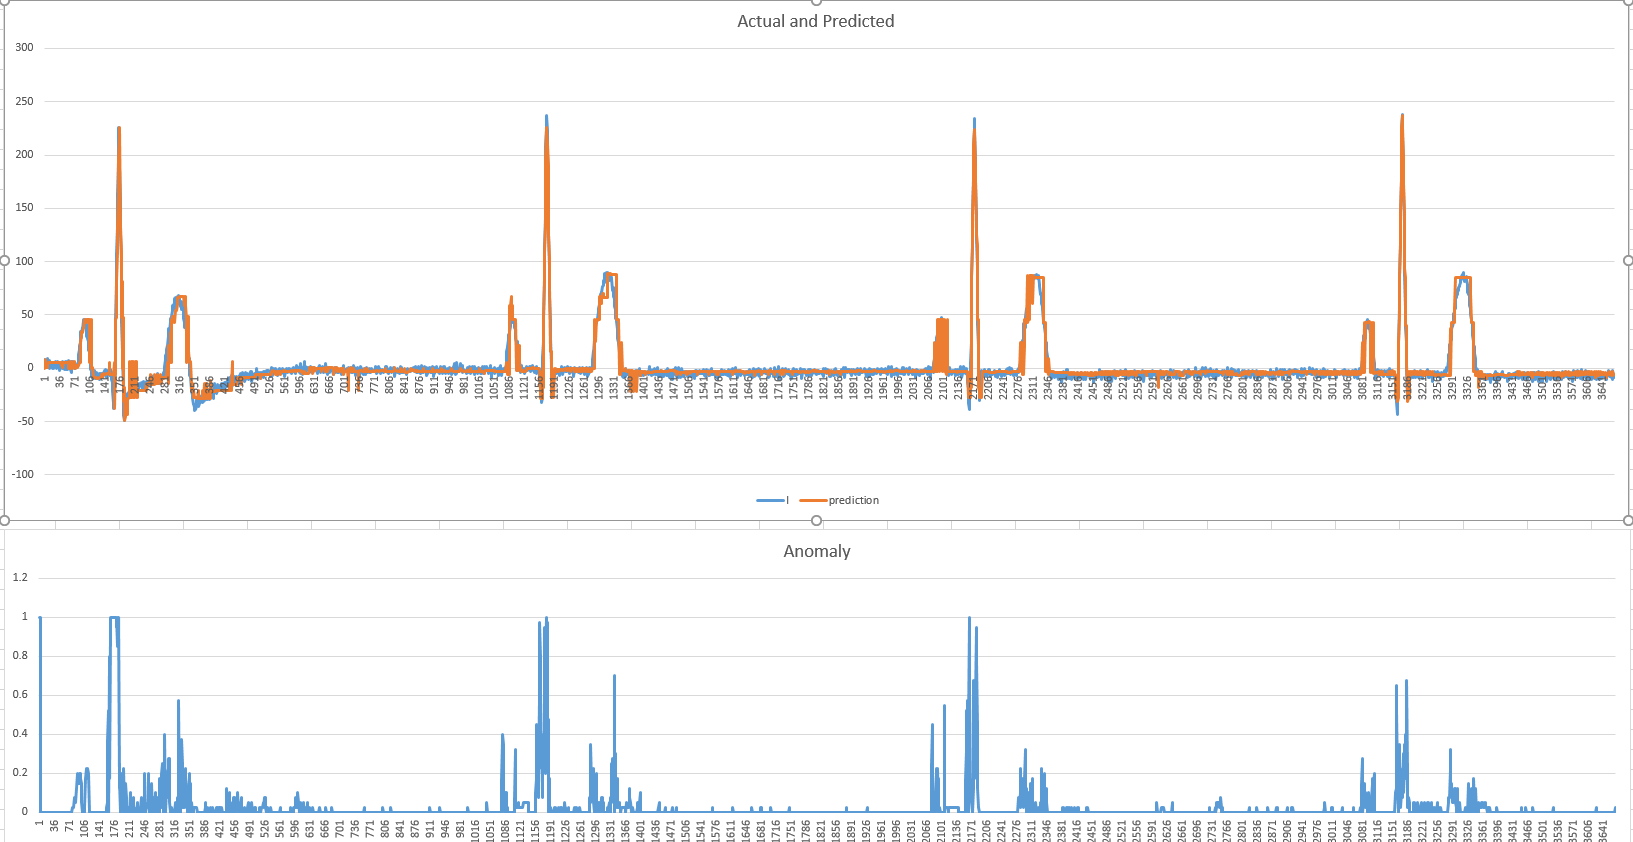
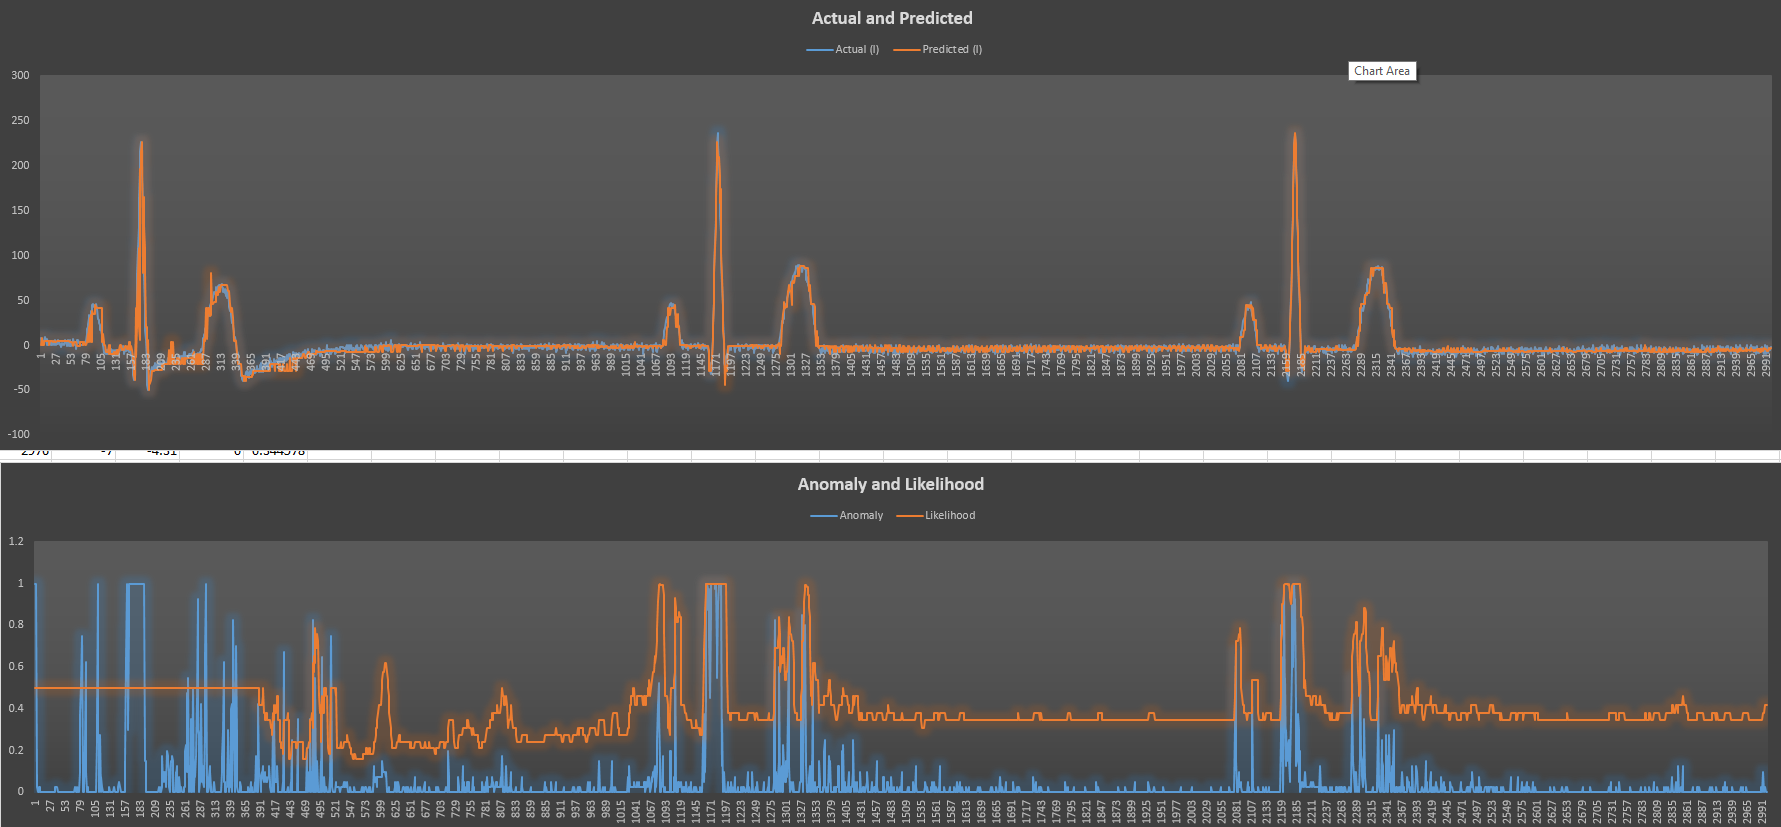
It gives me a likelihood of 0.5 throughout the entire data. So I assume I did something wrong in assigning these values. I tried other values though, and it still gave me that likelihood, so I’m stuck.
I just remembered something interesting. When I was trying out the hotgym anomaly demo with my data, I would always get an output of 0.5 in the graph below. Well, it looks like this is the same deal here. However, in the hotgym demo I didn’t really modify the code much, I just ran it through my data.
I can see from your code that you’re doing it wrong as I’ve successfully used likelihood, and although the first 400-ish values were indeed 0.5, all the rest were other than 0.5.
Insert these lines inside my template code in process_input.py at the corresponding line numbers
@Addonis: Unsolicited comment We are in similar boat (trying to get nupic run with most optimal settings). I am considering just using NAB as proxy with my own dataset. Afterall, it’s the key benchmark - so any optimal setting would make its way into this. Link here https://github.com/numenta/NAB
@vkruglikov nothing more than just printing out the header line/first line for the output file, describing which values are located in which column.
[row[0], row[predicted_field_row], “prediction”, “anomaly score”, “anomaly likelihood”] will stand for
For some reason I get an error saying columnCount and inputWidth need to be above zero when I try to run a RandomDistributedScalarEncoder over your template.
I just change
but I get those errors as I mentioned above. But I didn’t get errors when I did this in the one_gym demo.
I guess it won’t work like this because the one_gym uses other code with its encoder, right? I was wondering if you have a github with your code
Hi, sorry for the late answer
I’ve personally never experienced such an error before, so I don’t really know what the ‘columnCount and inputWidth above zero’ thing is about. However, I know that the “_classifierInput” is different from the normal non-classifierInput encoder (ie when name is _classifierInput and classifierOnly is true). I’ve noticed that the generated encoder parameters for the classifierInput are always bigger than for normal encoders and seems to affect the results of the CLA quite profoundly (in a negative outcome for me at least). I couldn’t find very much information about it so I decided to ask about it and other things in my post here, although none have dared to answer so far
If I remember correctly, one_gym simply runs a swarm, and uses the values from the model_params file to run the CLA on, which is exactly what my template code does, unless there is a difference in the input parameters that are sent to the swarm between my template and one_gym. No, I don’t have a github of my code, because my code is nothing more than the template really with ever so small variations here and there when I’m experimenting with different data sets. The NuPIC codebase is quite a behemoth so I haven’t dared altering any code really. All I’ve done is tried my best to understand HTM and NuPIC it, run it, understand why I get the results that I get, and use all that understanding to get the best possible results.
I think there is a difference, since the hotgym data uses the coded parameters from the energy and the weekly dates. But your template is more general, since it can take any file/input into it.
Anyway, thanks for the answer.
So then swarming is only needed if you want to predict something, not to detect anomalies, right?
For the most part, yes. If you are doing anomaly detection on non-scalar input data, you’re going to have to experiment because we don’t have pre-established model parameters for that stuff.
Is there an encoder to encode the difference between numbers in the data set? Or perhaps a percent change? It seems like encoding data using a diff or % change might preserve the pattern, while making it easier for HTM to predict this type of data.
Couldn’t this be done using a pre-processing step to output, say for instance: Original | Delta | %Change ? …in a cvs format and then have a Scalar or RandomDistributedScalar Encoder process these 3 columns?
I guess I should take a more in depth look through all of the encoders. I’m guessing there might be others, I’m still unaware of, that could be useful.
 We are in similar boat (trying to get nupic run with most optimal settings). I am considering just using NAB as proxy with my own dataset. Afterall, it’s the key benchmark - so any optimal setting would make its way into this. Link here