Hi,
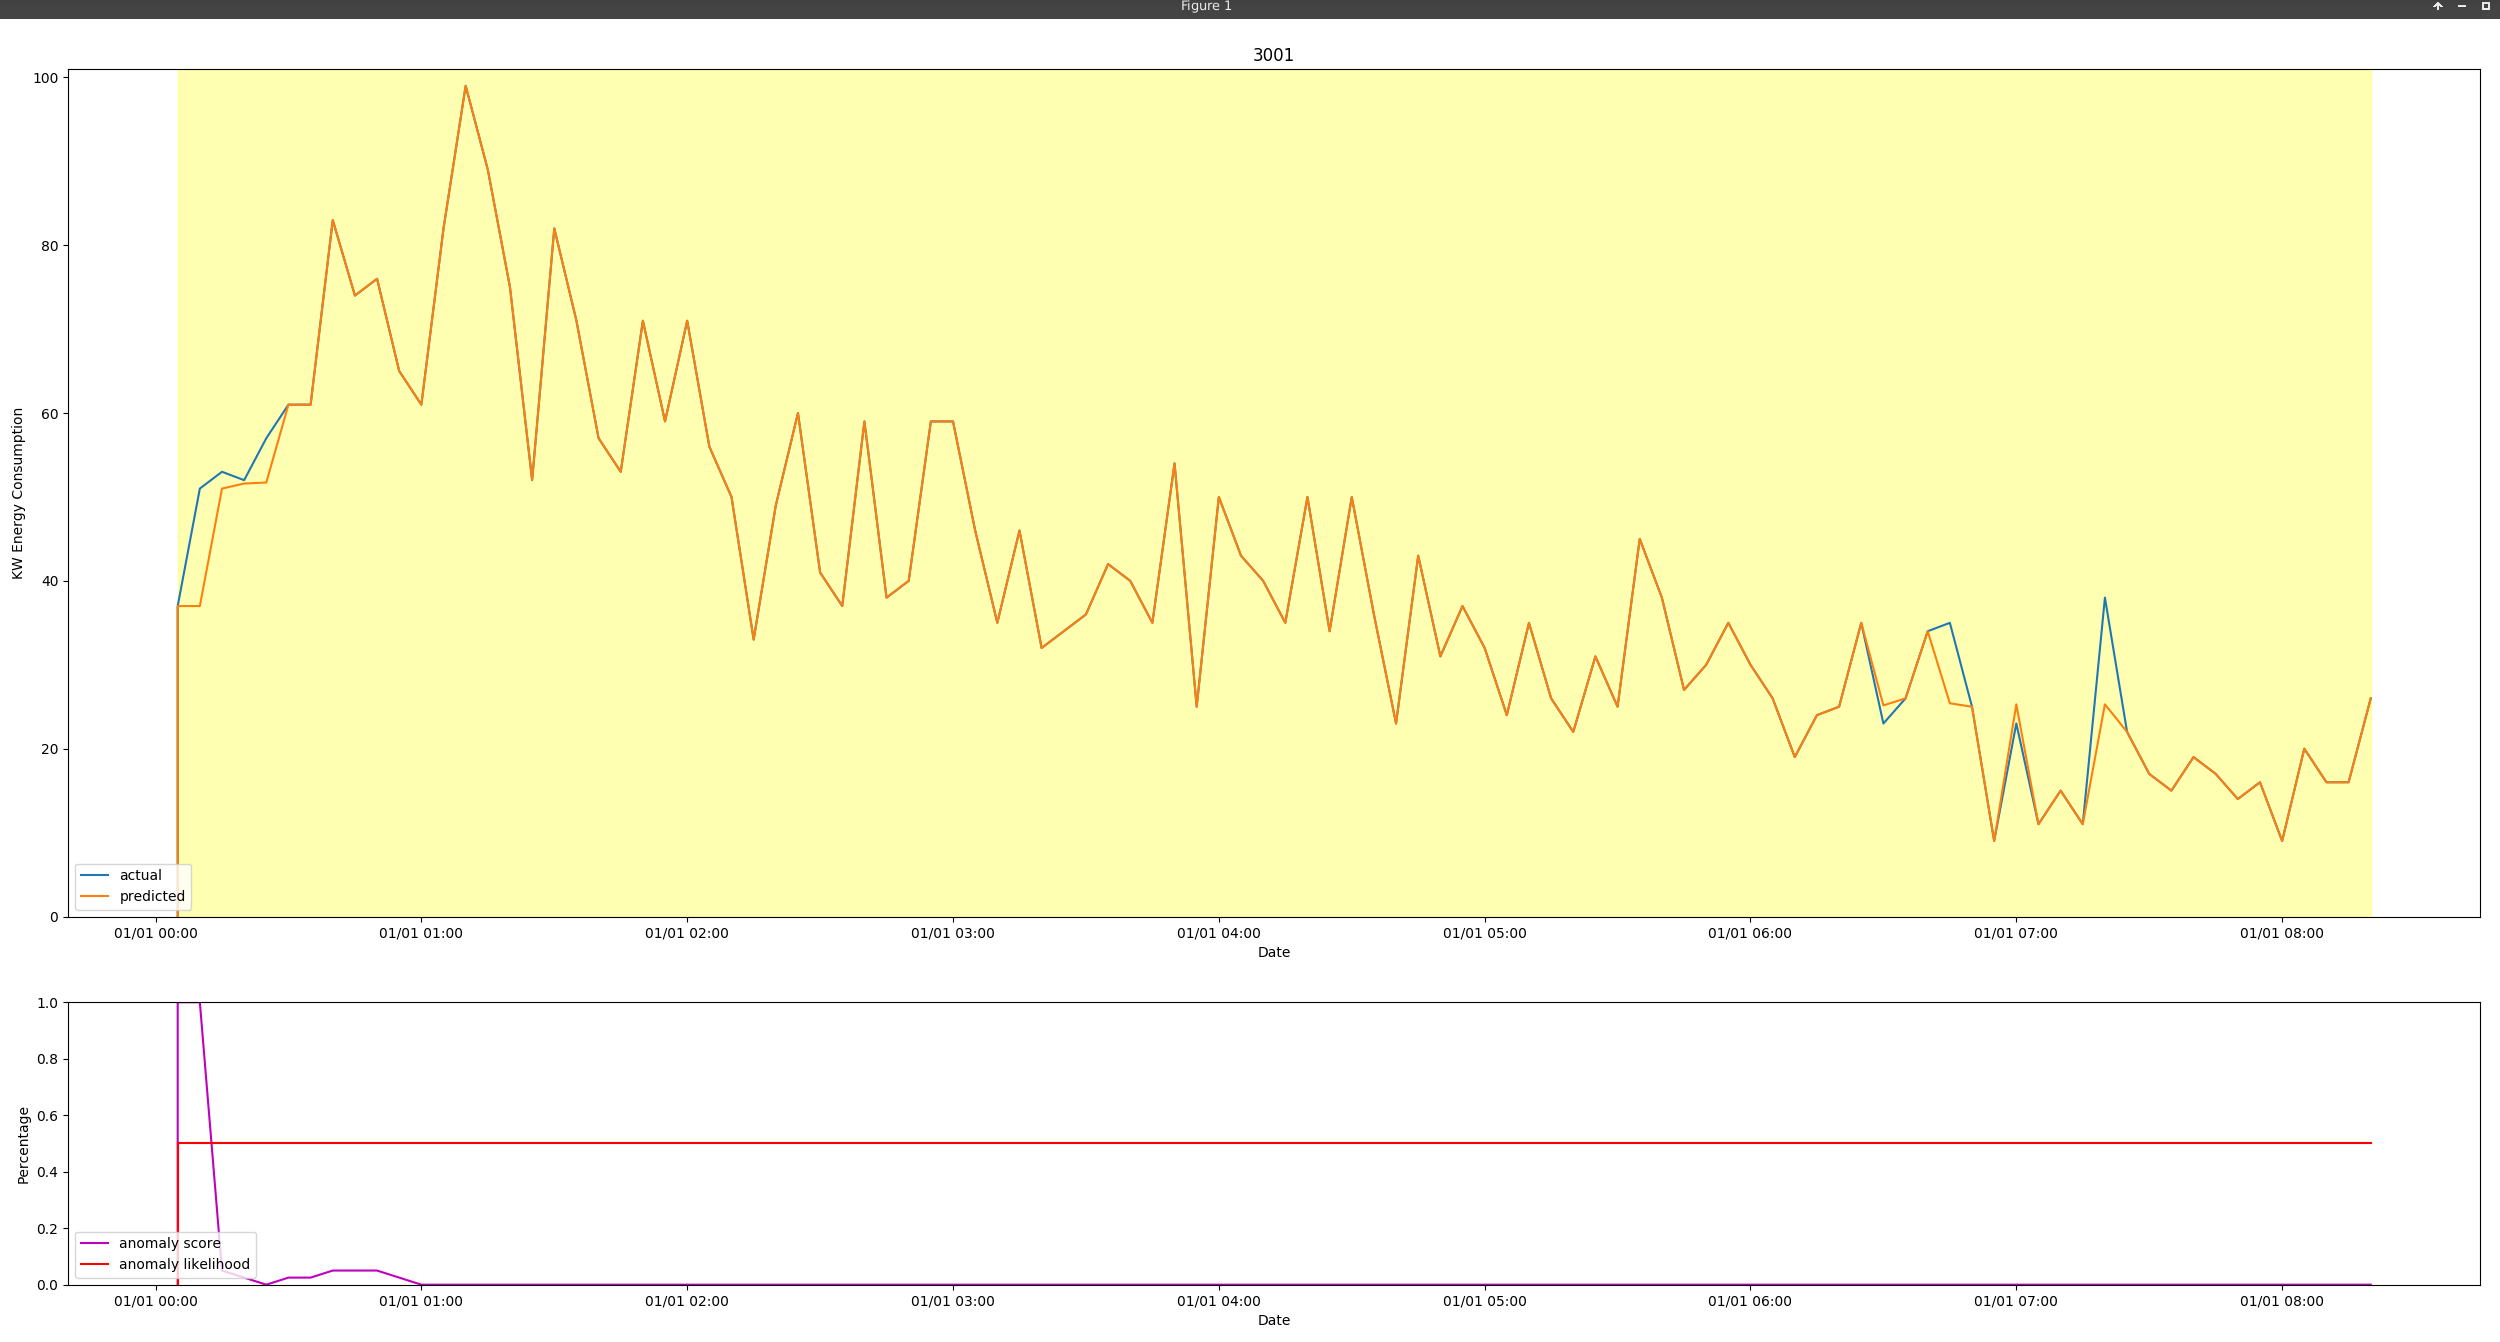
I’m using Nupic Anomaly Output plotter (https://github.com/numenta/nupic/blob/master/examples/opf/clients/hotgym/anomaly/one_gym/nupic_anomaly_output.py) from the hotgym folder and I’m not sure if I’m using it correctly. It seems to be putting the predictions on top of my observed values (which often makes it look like I’m getting perfect predictions because after a point, nupic will usually give you the previous value as its prediction.
My text output looks like (here the observed value is the value at time t, and predicted is the value predicted for time t :
initializing 3001
observed: 49 predicted: 37.0
observed: 37 predicted: 37.0
observed: 51 predicted: 51.0
observed: 53 predicted: 51.6
observed: 52 predicted: 51.72
observed: 57 predicted: 61.0
observed: 61 predicted: 61.0
observed: 61 predicted: 83.0
observed: 83 predicted: 74.0
observed: 74 predicted: 76.0
observed: 76 predicted: 65.0
observed: 65 predicted: 61.0
observed: 61 predicted: 82.0
observed: 82 predicted: 99.0
observed: 99 predicted: 89.0
observed: 89 predicted: 75.0
observed: 75 predicted: 52.0
observed: 52 predicted: 82.0
observed: 82 predicted: 71.0
observed: 71 predicted: 57.0
But my plot looks like this:
I had to add plt.pause(0.0001) after plt.draw() in order to make the animation work.
I’m using matplotlib 2.2.2 and nupic 1.0.3
My code is here:
threshold = 0.99995
def run_model(coll, data, location, si, ds):
    model = ModelFactory.create(MODEL_PARAMS)
    model.enableInference({'predictedField': 'measured_flow'})
    anomaly_likelihood_helper = anomaly_likelihood.AnomalyLikelihood()
    output = nupic_anomaly_output.NuPICPlotOutput('3001')
    last = None
    for row in data:
        to_process = make_input(row)
        result = model.run(to_process)
        raw_anomaly_score = result.inferences['anomalyScore']
        likelihood = anomaly_likelihood_helper.anomalyProbability(to_process['measured_flow'], raw_anomaly_score,
                                                                  to_process['timestamp'])
        pred = result.inferences["multiStepBestPredictions"][1]
        if last:
            output.write(to_process['timestamp'], to_process['measured_flow'], pred, raw_anomaly_score)
            print("observed:", last, "predicted:", pred)
        last = to_process['measured_flow']
        if likelihood >= threshold:
            print("Anonaly Detected!")
            doc = ({'intersection': '3001',
                    'algorithm': 'HTM',
                    'datetime': to_process['timestamp'],
                    'other': {'likelihood': likelihood, 'score': raw_anomaly_score}})
            print(doc)
Is this a bug or am I using the plotter wrong?