Performing Nonlinear Transformations automatically

tdlr

Given only a map of (nd) point-to-point conversions, and assuming a non-linear transformation, how do I infer the conversion point of a new point?

intro

I know this probably isn’t the best forum to discuss a math question like the one I have but my question, I believe, touches on the foundations of intelligence.

Intelligence is a process whereby a transformation of data from one space to another is learned. The fundamentals of how to do that are what I’d like to discuss and what I’d like to learn more about.

Also, keep in mind I have no background in math. I don’t speak it. This will be quickly apparent, I have to conceptualize everything with images. Talk to me like you would a highschooler… or small child.

problem

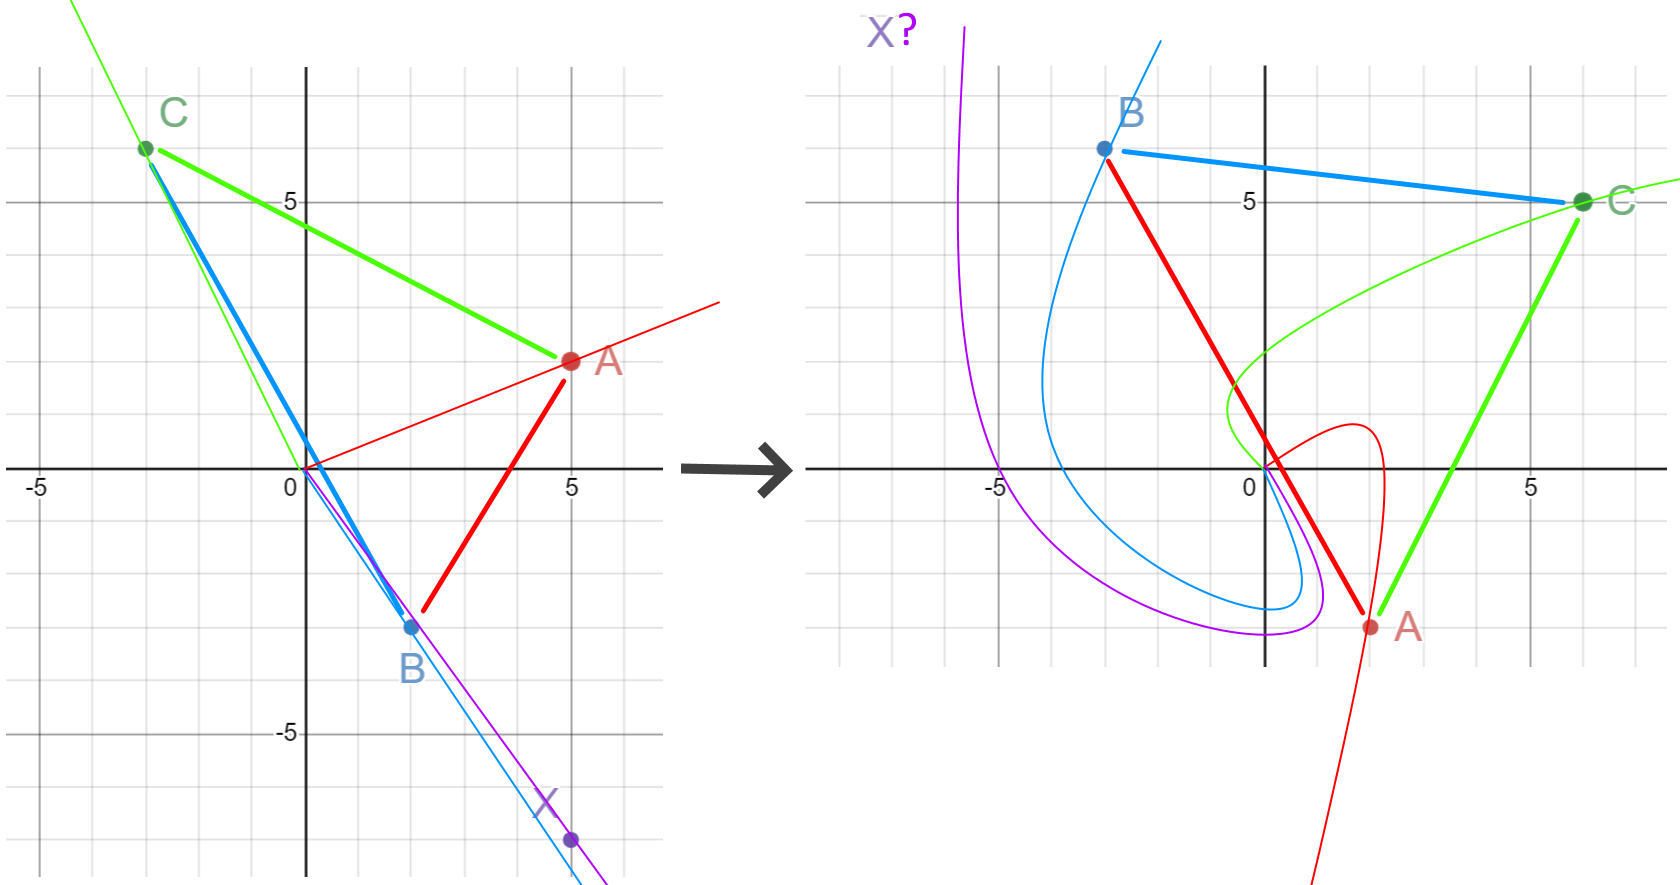
Imagine I have some data points A, B, C, X on a 2d graph like this:

And each of the points (except X) gets transformed to a new set of points like so:

(5, 2) -> (2, -3)
(2, -3) -> (-3, 6)
(-3, 6) -> (6, 5)
(5, -7) -> (?, ?)

To visualize the transformation, it kind of rotates a bit and stretches out a little:

So it goes from this to this:

The question is, where should X be placed in this new space?

There are actually at least a couple of answers to this question given various assumptions, I think. Firstly, you could assume a linear transformation, in my head that looks something like this (don’t know how to do the computation for this, if you do please let me know, but I can ballpark it using reasoning by analogy):

Ok, but I actually think the linear assumption is insufficient. What we really want is to assume a non-linear transformation.

Why?

Because non-linear transformations allow you to describe any transformation. Say we had thousands of points on this graph, not just 3. They might bend the space in all kinds of different ways on local scales. So as I’m trying to understand this, I take the most generalized non-linear transformation as my goal.

Then the question becomes, are there multiple ways to come up with a non-linear transformation from one set of points to another. Well, since I don’t know anything about math, I don’t know, but I have a hunch that the answer is yes.

My first intuition is to consider the origin. Don’t we have to consider where we place the origin?

If we leave the origin where it is the transformation over the whole graph implied by the data is one thing, but if we first move the origin to the center of the cluster of points (except for X) then infer the transformation, it is different. It feels to me like it would be more ‘simplified.’

origin remains at origin

origin at center of cluster (black lines)

Perhaps, in either case, the point-conversion (where they end up relative to each other) is the same so it doesn’t really matter. I don’t know if moving the origin to the center of the cluster before inference produces a different prediction of where X would be in the post-transformation-space (I assume it would), but it’s probably a good idea, just to reduce the complexity of the transformation. (I would assume).

In fact, since we know the distribution of points in the post-transformation-space we might as well take the center of that, take the center of the cluster of the input space and put the origin at the middle of the two points, then do the nonlinear inference to get the right place for our missing X point. But that’s just a tangential thought.

Question:

So the question really is: given only a map of point-to-point conversions, and assuming a non-linear transformation, how do I infer the conversion point of a new point? (in other words, solve for X, where should X go in the post-transformation-space)?

When I ask, “how do I infer…” I really mean how do I compute, since all I speak is code, not math.

afterthought

Perhaps assuming a linear transformation is fine, and much more efficient, so if that’s much easier great, but it just feels like I need a non-linear transformation because I want to describe the transformation exactly. That is I want to know the boundary exactly. Feel free to give me feedback on that.

Anyway, thanks for your attention, I am trying to write a function that will do this and I would appreciate any help you can give me!

def predict(input_coordinates, result_coordinates, point):
    '''
    given a set of input coordinates and their resulting
    coordinates post-transformation, and given an additional 
    input coordinate return the location (coordinate) in the
    post-transformation space that corresponds to the most
    logical non-linear transformation of that space for that
    additional point. "predict where this point ends up"
    '''

Thank you!

Edit: I just wanted to say, it seems obvious to me now that a non-linear transformation involving 3 points on a 2d graph is equivalent to a linear transformation involving 3 points on a 2d graph. More points, could warp the space in different ways unable to be expressed by a linear transformation but restrict it to 3 points, and the two models should be equivalent, and therefore make equivalent predictions about an additional point.

1 Like

Hey @jordan.kay, interesting and well-articulated idea here.

I think the core of the question is what kind of force do we imagine driving the movement of these points from time step 1 to 2. Is it a universal force effecting them? If so does it effect them all in the same way? Or is a more localized in that points depend on each other in some way? It seems like you could approximate a function for the movement of point X based on the aggregate movement of all others. That would seem to assume that X doesn’t have its own unique movement function tho. I’m not sure.

1 Like

I think a force that causes all the data points to move on one direction would be akin to a “translation” or a shift in linear geometric transformations. There are many other linear transformations as far as I’m aware, like mirroring about an axis, scaling, etc.

But what about non linear transformations? We really want to be able to describe any change, that is and combinations of changes.

As I’ve done more thinking on the question I’ve realized at least for the boundary denoting the inside of a cluster of points, the nonlinear transformation of space is there same as every possible group of points linear transformations of space. That means every 3 point combinations for a 2d space has to be computed and stitched together. Anyway that would probably suffice.

Anyway, to attempt a better answer to your question, I will share an example. Let’s imagine each datapoint is my heart rate every minute for the past year. Take every 2 minutes as an observation. What you have is an x, and y. Now you have thousands of observations plotted on a 2d space. You can then look at the observation that followed for each and you will have a new set of coordinates you can plot. Deriving the transformation from one space to another is my goal. You can do this in any number of dimensions you want too, why not all of them? The number of dimensions corresponds to the number of datapointa in your observation.

You may say well what’s the point of all this? Imagine I isolate the 6:58-7:00 observation for each day and it’s future observation 7:00-7:02. My alarm goes off at 7. The observations while I’m sleeping will be every different than the observations after I awake. So we will have a very particular mapping between the two spaces. That mapping is the signature of a real world event. I can predict what will happen today if I have the mapping of that time and extrapolate my 6:58-7:00 observation into the future space.

It seems like nn or any pattern recognition algorithm is essentially deriving this mapping. Why not infer it and use it to predict directly?

Thanks for you’re thoughts on the topic :slight_smile:

The simple, somewhat philosophical answer to your question is that there are potentially an infinite number of models that can be used to approximate the transformation of a discrete set of points. The challenge is to find the one (or ones) that are consistent with the known data that then also produce good results on previously unknown data. Practically the entire field of machine learning has been focused on this problem and there is a very large field of research devoted to regression analysis and approximation theory.

The key to developing a successful representation is to understand the underlying assumptions about the system that you are trying to model. For example, the most fundamental assumption that you are making is that the transformation is continuous (i.e. no sudden jumps or discontinuities in the values) over space. Each assumption you make about the data will influence which mathematical models and/or approximations you can utilize to represent the space and its transformation.

I’ve spent a lot of time thinking about such problems, as it is literally my day job to develop new techniques for solving complex models using computational simulations. Your original question is rather open-ended, and I could probably ramble on for quite some time on this topic. So, before I wander off into the weeds, do you have any more specific questions that you would like to have addressed? It would help me narrow down my response and make it more relevant to you.

1 Like

Yes, thanks! Well first of all, I’d like to focus in on this statement:

Here’s where I’d like some clarity to know if what I assume is correct.

Assumption #1: Given the 3-point example above, there is only one linear transformation that can be made, right?

Assumption #2: to find a non linear transformations we want to use Occam’s Razor which means we will always prefer the most simplified yet sufficient model, right? The reason I mention this is it reduces one of the vectors of infinite model variety to zero.

Assumption #3: in finding non linear transformations can we describe the difference in models by moving the origin before we infer the transformation? There are an infinite number of places the origin can go, does that infinite correspond 1:1 for the infinite variety of models?

One more thing I wish to make clear, the chosen non linear transformation is the model right? The two are one and the same?

I think I have other detailed questions too but if I could get these things cleared up that would help a ton I think. I have to make sure my assumptions are right to be able to build on them.

I wanted to update this thread because I believe I have a linear transform version of what I’m looking at. but I still lack a non-linear transformation version.

So with this linear transform version you, of course, want to avoid the possibility that the points disagree with one another. So you basically want to use the smallest number of points possible to describe a linear transformation. That means essentially creating a ‘triangle’ in any dimension since a triangle (3 points) describes a plane.

Anyway, hopefully, that makes sense, I guess what I’m really trying to say is, however many data points describe your observation is your N in N-dimensions. So you’ll want to plot and derive the transformation for N+1 observations, once you do that you can use the linear transformation inferred to extrapolate, or predict, a single new observation.

Here’s the code:

def extrapolate_linearly(
    domain_coordinates: list,
    result_coordinates: list,
    point: tuple
) -> np.array:
    '''
    extrapolate `point` into the results domain by first deriving the linear
    transformation between `domain_coodrinates` and `results_coordinates`
    if an observation, or coordinate, is 2D (x, y) then there should be 3
    observations included in both lists. point should be one observation.
    returns one coordinate.
    '''
    import numpy as np
    
    primary = np.array(domain_coordinates)
    secondary = np.array(result_coordinates)
    
    # Pad the data with ones, so that our transformation can do translations too
    n = primary.shape[0]
    pad = lambda x: np.hstack([x, np.ones((x.shape[0], 1))])
    unpad = lambda x: x[:,:-1]
    x_primary = pad(primary)
    y_secondary = pad(secondary)
    # print(x_primary)
    # print(y_secondary)

    # Solve the least squares problem X * A = Y
    # to find our transformation matrix
    transformation_matrix, res, rank, s = np.linalg.lstsq(x_primary, y_secondary)

    transform = lambda x: unpad(np.dot(pad(x), transformation_matrix))

    # print("Target:")
    # print(secondary)
    # print("Result:")
    # print(transform(primary))
    # print("Max error:", np.abs(secondary - transform(primary)).max())
    
    point = np.array([point])
    # print("Extrapolated Point:")
    # print(transform(point))
    
    return transform(point)[0]

extrapolate_linearly(
    domain_coordinates=[(5, 2), (2, -3), (-3, 6)],
    result_coordinates=[(2, -3), (-3, 6), (6, 5)],
    point=(5, -7))
# array([-7.        ,  5.30769231])

extrapolate_linearly(
    domain_coordinates=[(5, 2), (2, -3), (-3, 6)],
    result_coordinates=[(2, -3), (-3, 6), (6, 5)],
    point=(0, 5))
# array([5.        , 1.53846154])

I thought I’d update this thread not because everyone seems particularly interested in this idea, but just because I like you guys :kissing_smiling_eyes: and someone might want to see this someday.

Also, if there’s something wrong with the code, maybe you could spot it better than me. It seems to work well as far as I can tell, but like I said, I really want a non-linear generalized solution - that way many more points could be taken into account, without losing detail.

One other thought I had that I wanted to get your opinion about - can many linear transformations be made equivalent to one non-linear transformation?