Hi!
I’ve been trying to run a HTM model in a bunch of data I have. Though, the amount of data is huge - millions of data points - which is represented by a scalar value from a sensor of the x-axis of a rotating machine. Therefore, the data varies a lot. For example, in the first few thousands of data points the data usually is in a range of [10,-10], so I chose 0.4 as the scalar encoder resolution. I’m not encoding the time because it’s in milliseconds. Here is the data and the anomaly log likelihood plot:
Though, if I jump few millions data points ahead and run the HTM in the new data with the same 0.4 resolution, that’s what I got:
The only anomaly detected on this range of data points is where I circled in black. Thus, I think the value increase between the time [7175.0, 7177.5] didn’t generate an anomaly because it was smooth and I think that the HTM probably isn’t considering what should be “neighbors” on the new behavior (i.e values as 100 and 120 probably don’t have enough shared bits due to the 0.4 resolution), this is idea is right?
So, there is a way to update the encoder’s resolution while the HTM is running and don’t mess with the SP and the TM, or what I should do to handle this kind of data?
2 Likes
Hey @Tchesco,
This is a tricky scenario, nicely articulated.
Are you using a simple Scalar Encoder or an RDSE?
I think RDSE would be better because it creates new buckets for values outside the normal range – giving more flexibility to the encodings which it needs for such a big change in variation. This kind of scenario really highlights the limits of the normal Scalar Enc it seems.
2 Likes
I’m using a RDSE, but I think what’s really disturbing the HTM is the variability of data ranges throughout the dataset. For example, the anomaly score with the 0.4 resolution in the second example:
From what I’m awared of, the anomaly score should vary, but I don’t think this amount of variability is in the expected range. Though, when the resolution of the RDSE is set to 3 the anomaly score behaves a little bit more as the usual, though when the data variability increases the anomaly score starts “painting” all the plot again:
1 Like
Would it be viable to do some kind of data aggregation in your application here? I ask because milliseconds is quite a small time increment, so I imagine the sequential patterns would consist of many, many time steps each. It would be much easier & faster for the TM to pick up the patterns if they were shorter (consisted of fewer data points).
To be a little more concrete, let’s say a pattern in your data is something like:
ABAC ABAC ABAC ABAC
but because the sampling rate is so high, the TM is actually getting:
AAAABBBBAAAACCCC AAAABBBBAAAACCCC AAAABBBBAAAACCCC AAAABBBBAAAACCCC
The TM (and probably any sequence learner) would have a much easier time with the first simpler sequence, rather than the second more complex sequence with the higher sample rate.
I’d be curious to see the raw data plotted after aggregation, to get a sense if the signal is coming out more clearly. If you sample down from milliseconds to seconds that would reduce the data size and noise a lot, and you’d still be evaluating the sensor every second – which is hopefully still frequently enough for your purpose.
1 Like
I’m really grateful for your help, thanks!
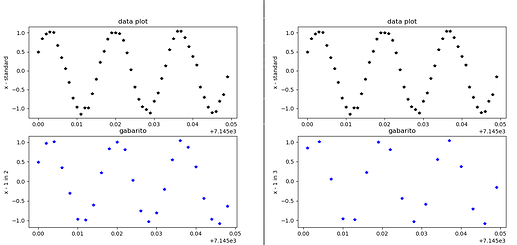
Here I plotted the data with a star “*” marker to make the data points more clear. In both figures the top graph is the standard input and both of the blue plots are selecting 1 every 2 or 1 every 3 data points, the “left” blue is 1 every 2 and the “right” blue on is 1 every 3 data points.
Though, I don’t think the data could fit in seconds, because the sensor capture each signal every millisecond.
I will run the HTM tests and as soon as possible I give a feedback about the anomaly graphs.
1 Like
Subsampling is one way to go certainly.
I still think it’s worth trying aggregation as well, like instead of skipping 2 of every 3 data point take the sum of all 3 to make a new 1 data point. This way all 3 original data are still baked in.
I guess I’m not sure what you mean by “fit” here.
The sensor captures every millisecond (so 1000 data points per second), but that doesn’t necessarily mean you have to evaluate the system 1000 times per second, right?
To be totally concrete, what I’m suggesting is:
-
let the sensor gather 1000 data points in 1 second
-
take the sum or mean of those 1000 points (which yields 1 data point for that second)
-
feed that 1 point into the HTM model and get the anomaly score
It doesn’t need to be 1 data point per second exactly of course, you could try 3 per second for example (so take the mean of every 333 sensor values instead of every 1000). Or even less, say 1 data point for ever 5 seconds.
The reason I suggest this is because it should make for much, much simpler patterns for the HTM to learn, which will make the anomaly scores much more meaningful.
I’m not familiar the domain specifics of your purpose or anything, but I’d always rather have less frequent anomaly scores with more meaning than more frequent anomaly scores with less meaning.
And if the data takes nice periodic shapes like those in your plots, it should be possible for the anomaly scores to settle down pretty fast.


