Unexpected results for complex periods data

Hi everyone,

We’re recently using nupic as an anomaly detector in a complex periods data envolving daily period/weekly period/monthly period. Thus, we’re getting data from seven different nodes into the same cluster, the load are well balanced so each node is processing the same number of requests (the metric that we’re analizing is our web site load) and all of them have the same behaviour.

Some more context:

1.- Our data are five minutes aggregated with two months deep. We’re processing data split by nodes in different and isolated streams.

2.- That’s the best model we found. (Unexpectedly, without timeOfWeek and weekend enconding)

{
  "inferenceArgs": {
  "predictionSteps": [1],
  "predictedField": "c1",
  "inputPredictedField": "auto"
},
"aggregationInfo": {
    "days": 0,
    "fields": [],
    "hours": 0,
    "microseconds": 0,
    "milliseconds": 0,
    "minutes": 0,
    "months": 0,
    "seconds": 0,
    "weeks": 0,
    "years": 0
},
"model": "CLA",
"modelParams": {
    "anomalyParams": {
        "anomalyCacheRecords": null,
        "autoDetectThreshold": null,
        "autoDetectWaitRecords": 5030
    },
    "clEnable": true,
    "clParams": {
        "alpha": 0.035828933612157998,
        "clVerbosity": 0,
        "regionName": "CLAClassifierRegion",
        "steps": "1"
    },
    "inferenceType": "TemporalMultiStep",
    "sensorParams": {
        "encoders": {
            "timestamp_timeOfDay": {
                "fieldname": "timestamp",
                "name": "timestamp_timeOfDay",
                "timeOfDay": [
                    21,
                    9.5
                ],
                "type": "DateEncoder"
            },
            "timestamp_dayOfWeek": null,
            "timestamp_weekend": null,
            "value": {
                "name": "value",
                "fieldname": "value",
                "numBuckets": 150,
                "seed": 42,
                "type": "RandomDistributedScalarEncoder"
            }
        },
        "sensorAutoReset": null,
        "verbosity": 0
    },
    "spEnable": true,
    "spParams": {
        "potentialPct": 0.8,
        "columnCount": 2048,
        "globalInhibition": 1,
        "inputWidth": 0,
        "maxBoost": 1.0,
        "numActiveColumnsPerInhArea": 40,
        "seed": 1956,
        "spVerbosity": 0,
        "spatialImp": "cpp",
        "synPermActiveInc": 0.003,
        "synPermConnected": 0.2,
        "synPermInactiveDec": 0.0005
    },
    "tpEnable": true,
    "tpParams": {
        "activationThreshold": 13,
        "cellsPerColumn": 32,
        "columnCount": 2048,
        "globalDecay": 0.0,
        "initialPerm": 0.21,
        "inputWidth": 2048,
        "maxAge": 0,
        "maxSegmentsPerCell": 128,
        "maxSynapsesPerSegment": 32,
        "minThreshold": 10,
        "newSynapseCount": 20,
        "outputType": "normal",
        "pamLength": 3,
        "permanenceDec": 0.1,
        "permanenceInc": 0.1,
        "seed": 1960,
        "temporalImp": "cpp",
        "verbosity": 0
    },
    "trainSPNetOnlyIfRequested": false
},
"predictAheadTime": null,
"version": 1
}

So, we hope get the same results (more or less) for all the nodes.
But…
1.- We’re getting a lot of diferences (anomalyLikelihood) between similar series. In peaks, not all series are reporting a high anomalyLikeHood ( > 0.80)
2.- Very clear anomalies are not detected (Detected anomalies are marked with a red circle)

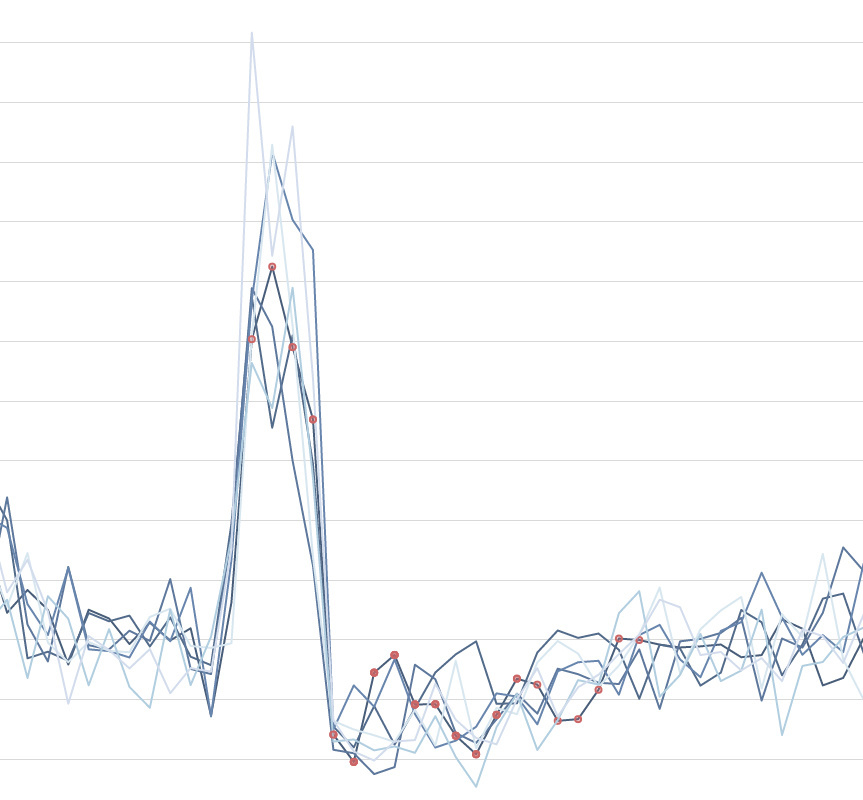
3.- Strongs falls in the metrics aren’t detected

We’re a little lost. So any sugestion will be appreciated.

Regards

Hey there, this definitely looks like data that NuPIC should be able to handle really well. I’ll address some of your questions in no particular order:

  • I wouldn’t be too worried that it didn’t pick up dayOfWeek or weekend encoders. It will still learn different sequences for the week days and weekends and when it starts seeing records that fit a weekend sequence, it will lock into that. There are some cases where the data makes this difficult and the weekday/weekend encoding can help but it isn’t always needed.
  • There are a couple reasons why some things that look anomalous might not be flagged. One is that the “anomaly” may be lost in the noise. If the prediction error (raw anomaly score) is high, but the data is noisy and regularly has high prediction error, then it might not turn into a high likelihood score. Another reason is that if the “anomaly” has been seen before then it might have been learned. In this case, it will be predicted and result in low scores.
  • In NAB, we were missing some spatial anomalies because the high prediction error was common in the noisy data stream. We added a simple solution - check for any value more than 5% outside the range of values seen so far and automatically give that record a likelihood of 1.0. It’s a bit of a hack, but it addresses these very noticable “missed” anomalies that aren’t really anomalies by our definition. We are considering whether we should add this to our likelihood code so let me know if you think we should.
  • If you think some “anomalies” aren’t flagged because they occur multiple times and get learned by the model, you can try using the anomaly classifier. This anomaly classifier let’s you specify an anomaly that you want to remember so that if that pattern happens again you can tell, even if it isn’t an anomaly anymore.
  • You can try adding a delta encoder. This may or may not help catch some of the missed anomalies.

It’s hard to say why streams that look similar would have different behavior. Perhaps one stream has more repeatable patterns that the model can learn. Perhaps one is less predictable, resulting in higher prediction error in general, in turn making it harder to find anomalies in the noise.

Please follow up if you try any of these things or have more questions!

2 Likes

Hi Scott,

Thanks for your quick response. As soon we get some results testing yours sugestions, we will update the topic.

Regards from Spain

Juan

Hi,

About this quote, some reflexions:

Below you can see a usual week in our systems, not incidences, not problems, just normal activity. We called “family of elephants” from The little prince :smirk:

Every days have the same pattern, load is reduced on weekend, but basically maintains the same “wave” and during first week of month, elephants are bigger. So for us, it is more interesting suddenly peaks or falls in the value, than the value itself meanwhile the pattern (elephant form) is mantained.

Instead of a delta we’re thinking to use a derivative function from the original serie, in order to get “the velocity of change” as a new data stream. We talked about normalization too, but we think it only reduces the range value, not the form of the stream. Although normalization can help us to reduce the noise.

And also, periodically we’ve got stress tests which produce very high peaks, so the max value into the range is higher than usual activity, more than 5%.

Really, I concern this huge peak can distort our result, but our tests without stress test peaks are not better.

Regards.

Juan

Juan,

As a sanity test, have you tried downloading the HTM Studio app and running your data through it? It uses NuPIC but there’s a bunch of encoding and aggregation related stuff it automates so it might be a good baseline.

Subutai

Hi @subutai,

Yes, of course. It was our first tests, but right now we’re getting some better results with our models (using Delta and Random Distribution Scalar encoding together as @scott recommended us).

But the results are still away from a good accuracy compared with a traditional LSTM (that’s our actual baseline). We’re “playing” with the resolution or others NuPic parameters but always jumping from a high ( a lot of false positives ) to a low sensibility (ignoring huge peaks).

We’ve got the code from nupic workshop, so we’re suspecting maybe there are a more complex ways to run the models but we don’t found a clear example or any instructions about how to follow, just NAB but we’ve read in the forum that it’s not a good idea change it to use with our datasets

We have yet to try the anomaly classifier. But we’re very interesting in an unsupervised mode, so we wonder if this encoder is a option.

Regards.

Juan

OK, that’s good to know. Our best code for anomaly detection is in NAB:

With log likelihoods we typically use a threshold around 0.5. Not sure why people told you not to look there, as it’s a good starting point.

The aggregation level could be useful to set as well if 5-minute data is too noisy, so aggregationInfo is something you could experiment with. HTM Studio tries to estimate the best aggregation level for your data. If you click on “Results” it should tell you what it thought was the best aggregation level. It uses some heuristics, so may not be ideal for your data, but might give you some hints.

1 Like

Thanks Subutai, I already have homework to do :slight_smile:

Juan

1 Like

Hello,

with new parameters and using RandomDistributedScalar and Delta encoders without any aggregation level, we’re getting better results even procesing real data, not only a prepared dataset. And similar temporal series are showing similar anomaly likelyhood.

So we’re moderate happy, we continue working on it.

Juan

2 Likes